Metrics & customer feedback together
Your dashboard tells you what happened. Your customers can tell you why.
Imaging you’re looking at your analytics dashboard on a Monday morning.
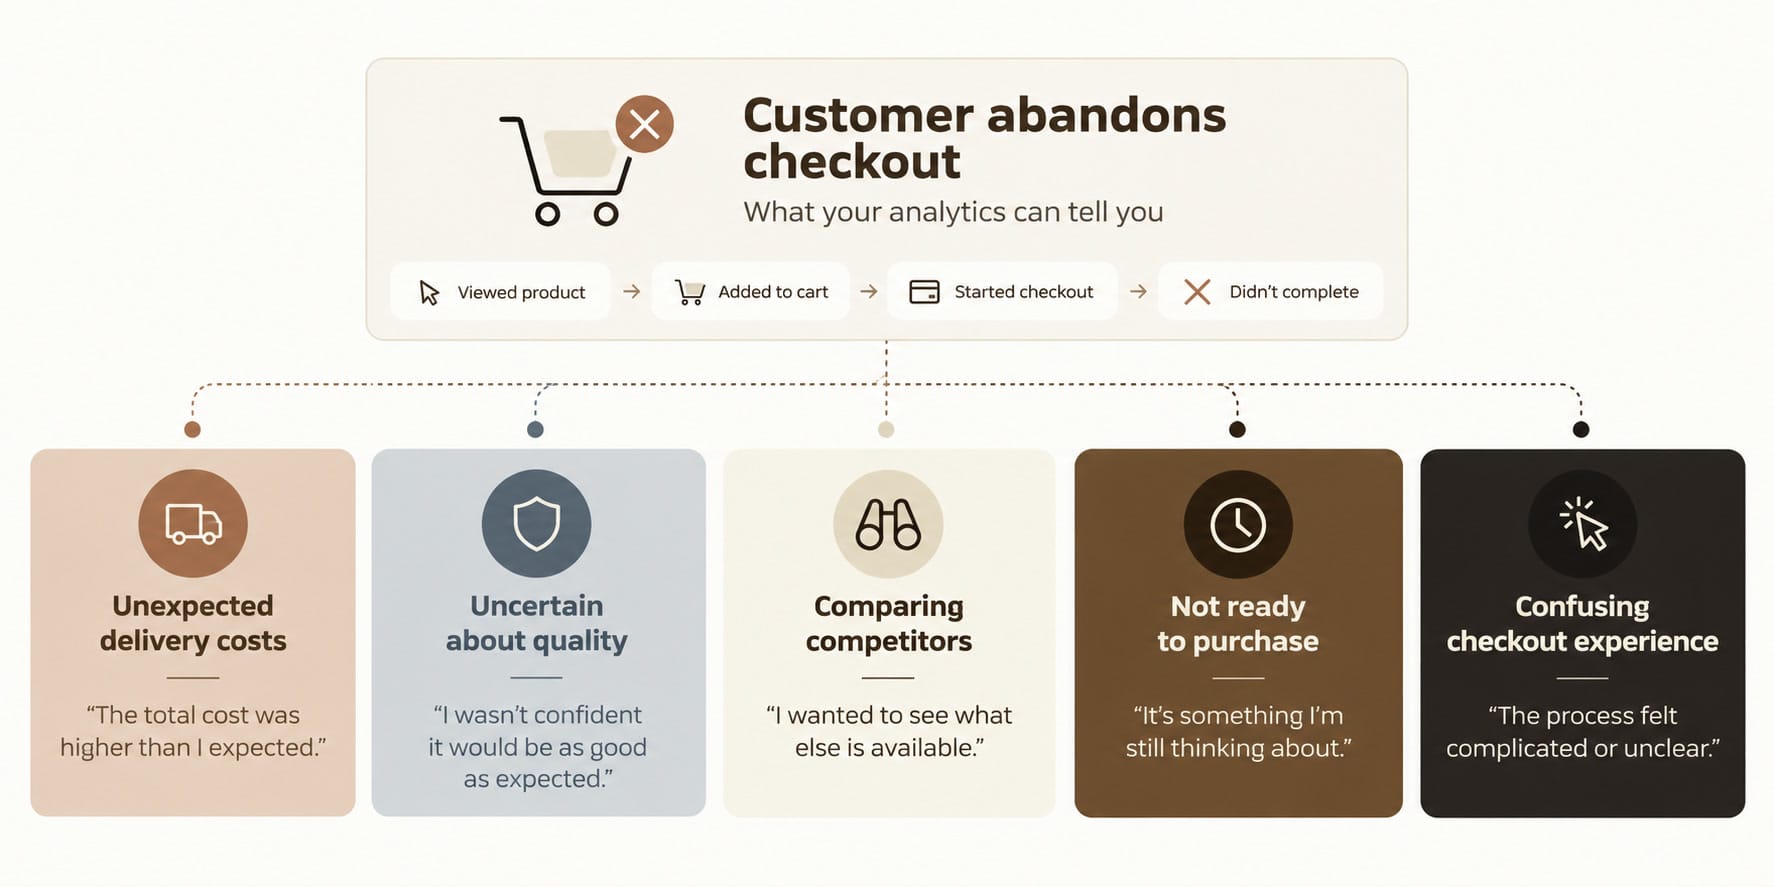
Traffic is up, UVs through the top of the funnel are at the same as it has been. ATC rate is holding steady. But somewhere between adding to cart and checking out, people are disappearing more than they used to. Looking deeper through the past few weeks, you see this is a clear trend.
It’s the normal process after looking at a dashboard. The numbers are the discovery of the problem. They tell you exactly where. Unfortunately, they never really can tell you why.
That’s where the investigation begins. A hypothesis on what may be driving the drop. Was it a campaign that flopped or attracted the wrong group of people? Is this just us or is it across other retailers in the vertical? Were there any recent changes to the checkout? Any outages? Any social media or PR issues?
Maybe the delivery costs were unexpected. Maybe customers found a better price elsewhere. Maybe they weren’t ready to buy.
Or maybe the product simply wasn’t what they thought it would be.
All reasonable explanations.
But which one is actually true?
That’s where things get interesting.
We’re very good at measuring behaviour
Businesses have become incredibly sophisticated at tracking what customers do.
You can measure which pages people visit, how long they spend browsing, which buttons they click and where they abandon a journey. You build detailed funnels, identify drop-off points and segment customers based on their actions.
100% table stakes, and those that do this best as a regular part of any decision are usually in the businesses that are pulling ahead of their competition.
However, somewhere along the way we’ve started treating behavioural data as though it explains behaviour.
Sometimes is does and is clearcut. More often, a hypothesis that is acted on comes down to a gut feel on interpretation (or a HiPPO in the room)
Take a customer who visits a pricing page three times without signing up.
One interpretation is that the product is too expensive.
Another is that they’re comparing competitors.
Or perhaps they need approval from someone else?
Maybe they simply don’t understand what they’re getting.
The behaviour is identical. The motivations are completely different. Which one of those motivations is the main driver? What is second, and are any of the drivers related?
And depending on which explanation is true, the business response would shift to accomodate.
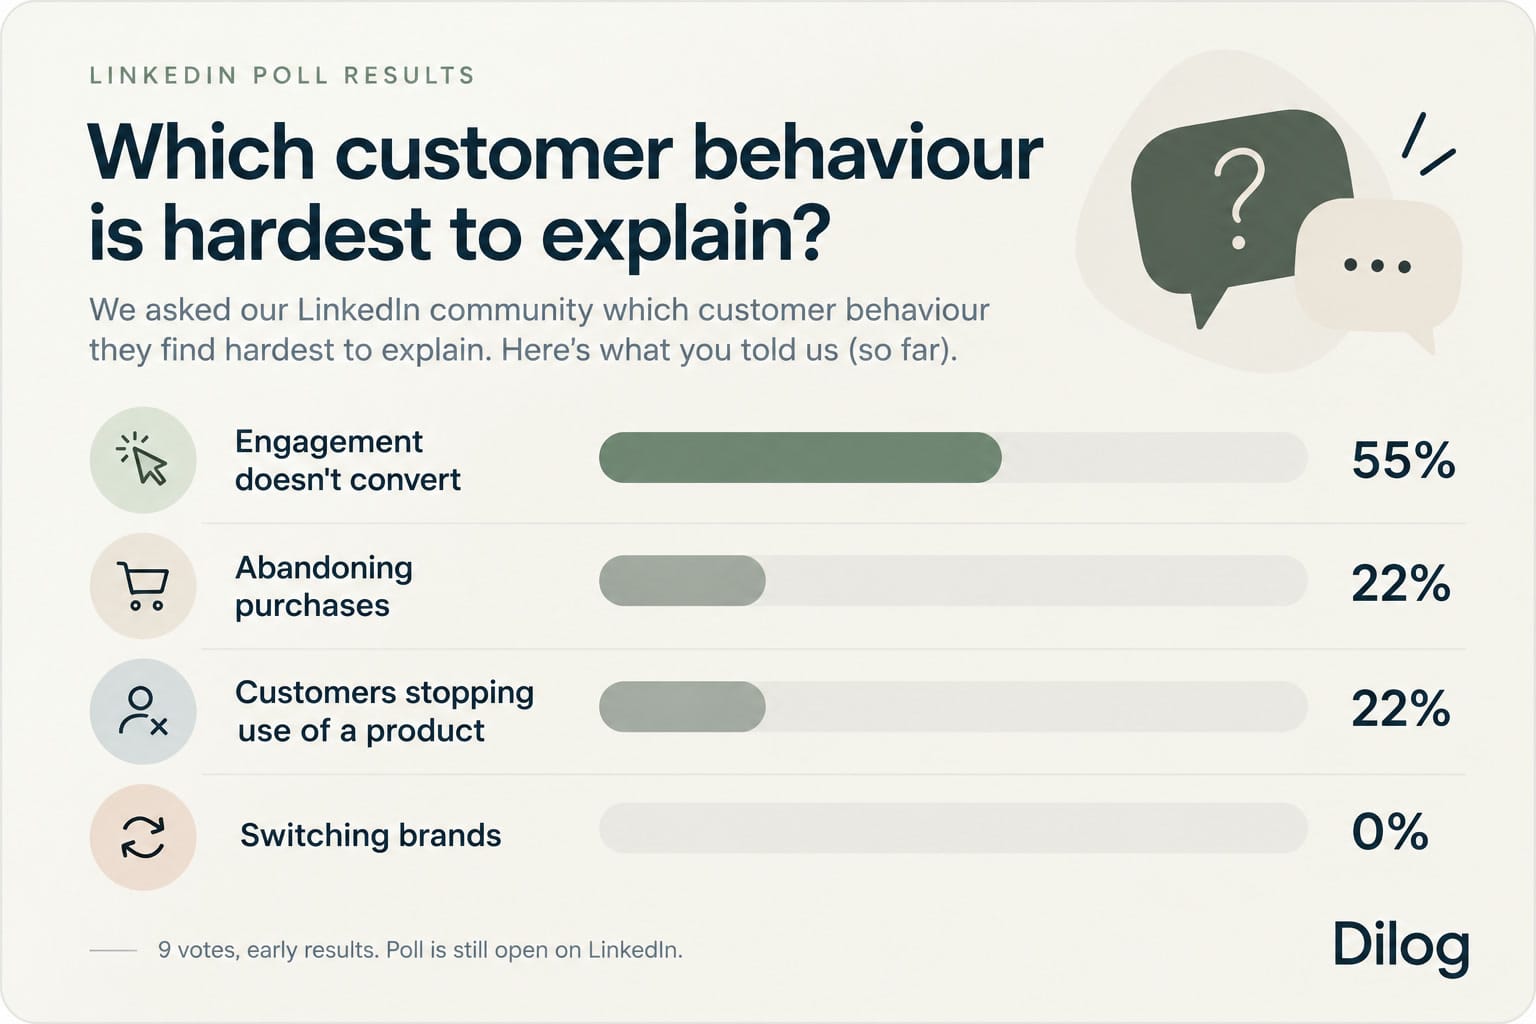
When someone repeatedly visits a pricing page but doesn’t convert, what’s your first hypothesis?
- The price is too high
- They're comparing alternatives
- They're not ready to commit
- They don't understand the value
Unfortunately, there’s so rarely a single correct answer. That’s precisely the point.
The numbers and analysis are only the starting point for a hypothesis-test-iteration loop.
Consider what’s happening with Australian consumers right now. The October 2026 Westpac–Melbourne Institute Consumer Sentiment Index was reported at 80.4. This is a considerable drop from a year ago, which makes sense to anyone that has filled up at a servo or did the grocery run recently.
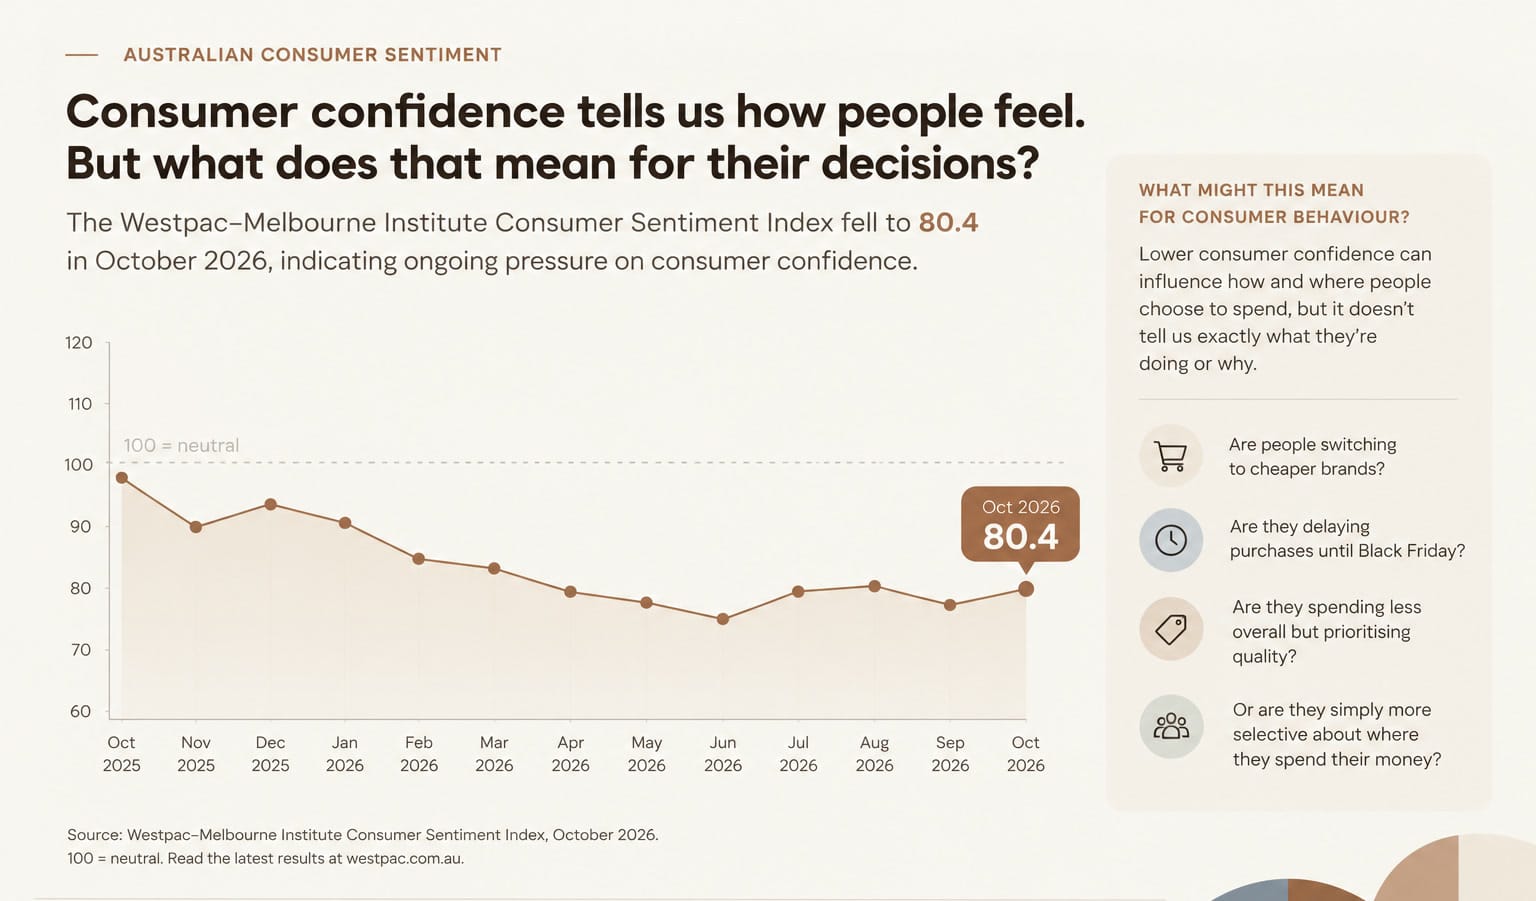
The Index is a useful indication of how consumers are feeling about economic conditions. However, it doesn’t tell us exactly how those concerns are influencing individual purchasing decisions.
Are people switching to cheaper brands?
Or possibly delaying purchases until Black Friday?
Are they spending less overall, but prioritising products viewed as lasting longer?
Or becoming more selective about where they spend their money?
Data around macro economic conditions is always useful. Added to the internal tracking of what is happening on your own sites/apps you get a clearer picture. That should give you a clear picture of the issue and the trend.
The normal process for iteration goes from there. Deciding on if this is worth addressing (your time is limited!). Testing takes time in any organisation!
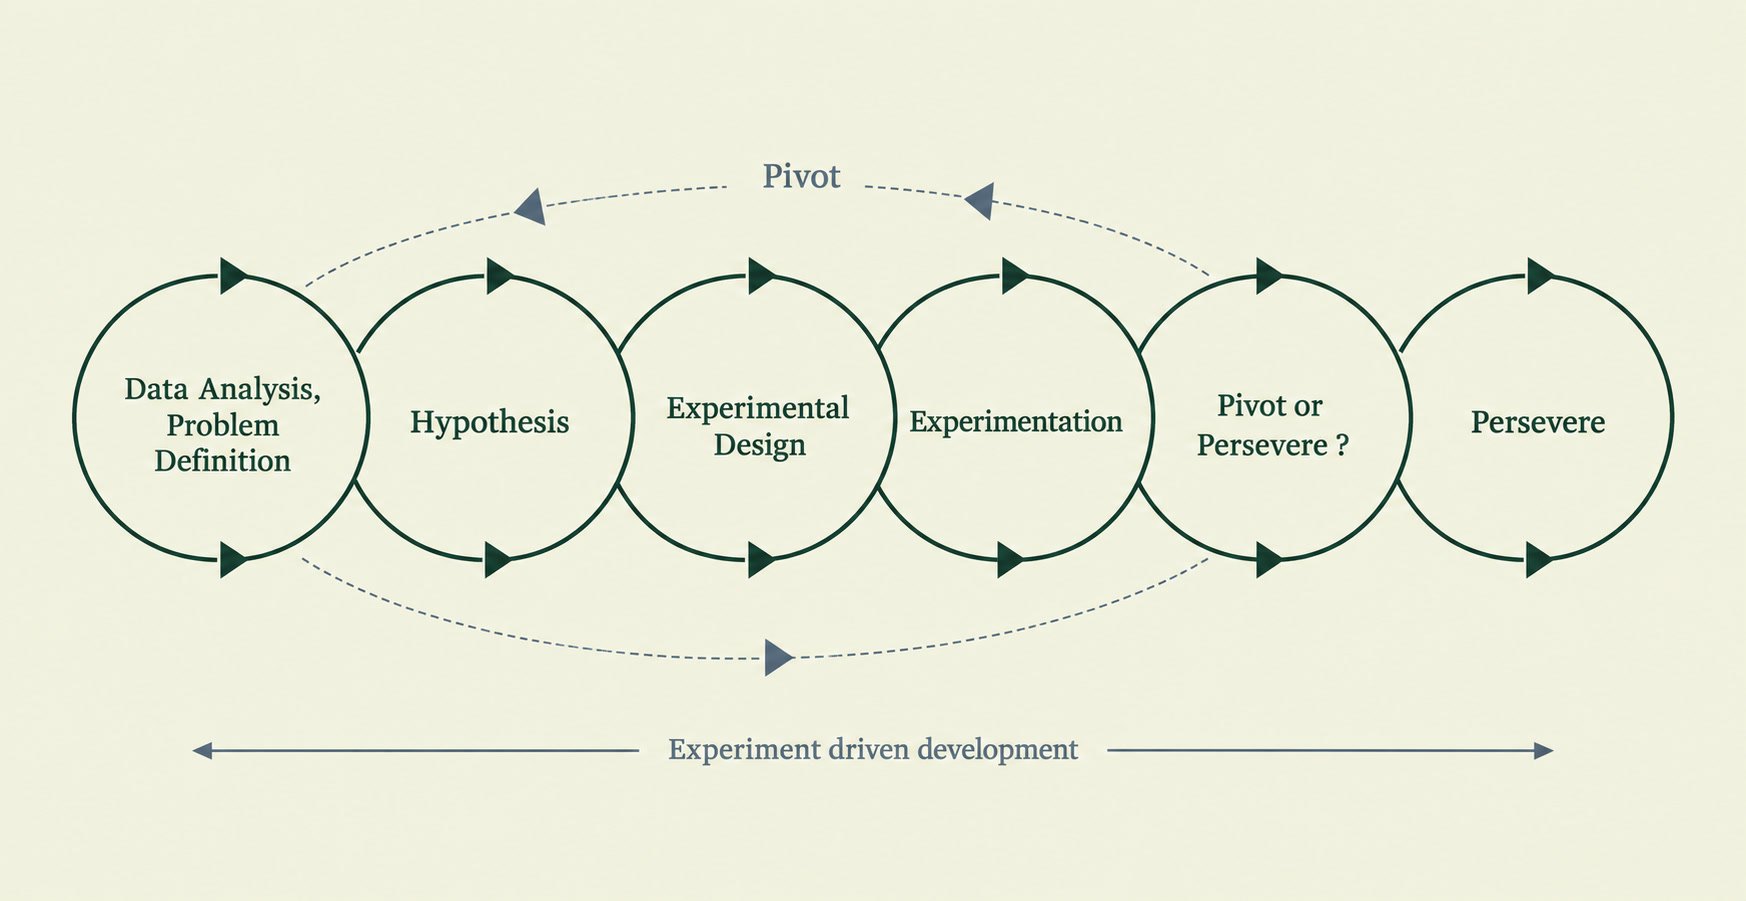
Given that this loop would normally take 2-3 weeks minimum at any medium or large org, it’s worth it to try and get as close to the best hypothesis as possible given the analysis. It means balancing the time it would take to do a full analysis and understand the customer drivers vs the impact of making a change.
Remember that this isn’t a “one-and-done” process, although sometimes it is treated as such. Studies showing appx 10% of experiments yielded the expected results (Harvard and Booking.com study, 2019). Others results for product managers and UX designers are showing that on average teams needed 2-4 iterations on a problem before the stated KPI was met.
Imagine the results if you could collapse just one of those iteration loops on a majority of your work?!
So for that first step of analysing to get to a good hypothesis, recall that what you are looking at primarily is the quant data. That describes the “what” for you. On average, there are five things your data analytics probably can't explain (and that is unfortunately a blind spot for any hypothesis created before you actually start work!)
Why somebody decided not to buy (or browse, or click, or engage).
You can’t automatically determine the drivers of a customer’s action. Whether the issue was price, trust, timing or something else. Baymard’s research into reasons for cart abandonment demonstrates how different motivations can contribute to the same outcome.
The main drivers of an observed event across customers can vary widely, and require different changes to address.
Why customers choose a competitor.
A lost sale doesn’t necessarily mean a competitor offered a lower price. Their product might have felt easier to understand, more trustworthy or better suited to the customer’s needs.
Understanding those differences can help businesses identify opportunities beyond discounting.
What someone actually means by “too expensive”
Sometimes it means they can’t afford it. Sometimes it means they don’t see enough value. And sometimes it means they’re unsure whether the product will deliver what they’re expecting. Again, different customer problems will lead to different solutions to address those needs.
Why a customer stopped using your product or visiting your site.
A decline in usage might signal dissatisfaction, but it could also mean the customer achieved what they needed, changed motivation, or no longer has the same problem. Without additional context, it’s difficult to know which explanation is accurate.
What almost convinced someone to stay.
We tend to focus on the final decision, but an understanding of the thought process and consideration before making that decision can be just as useful.
Layering in as much as possible of the “Why” on top of the “What” in that early stage of formulating your hypothesis can only be beneficial. The tradeoff is around how much you can do given the time and resources on hand.
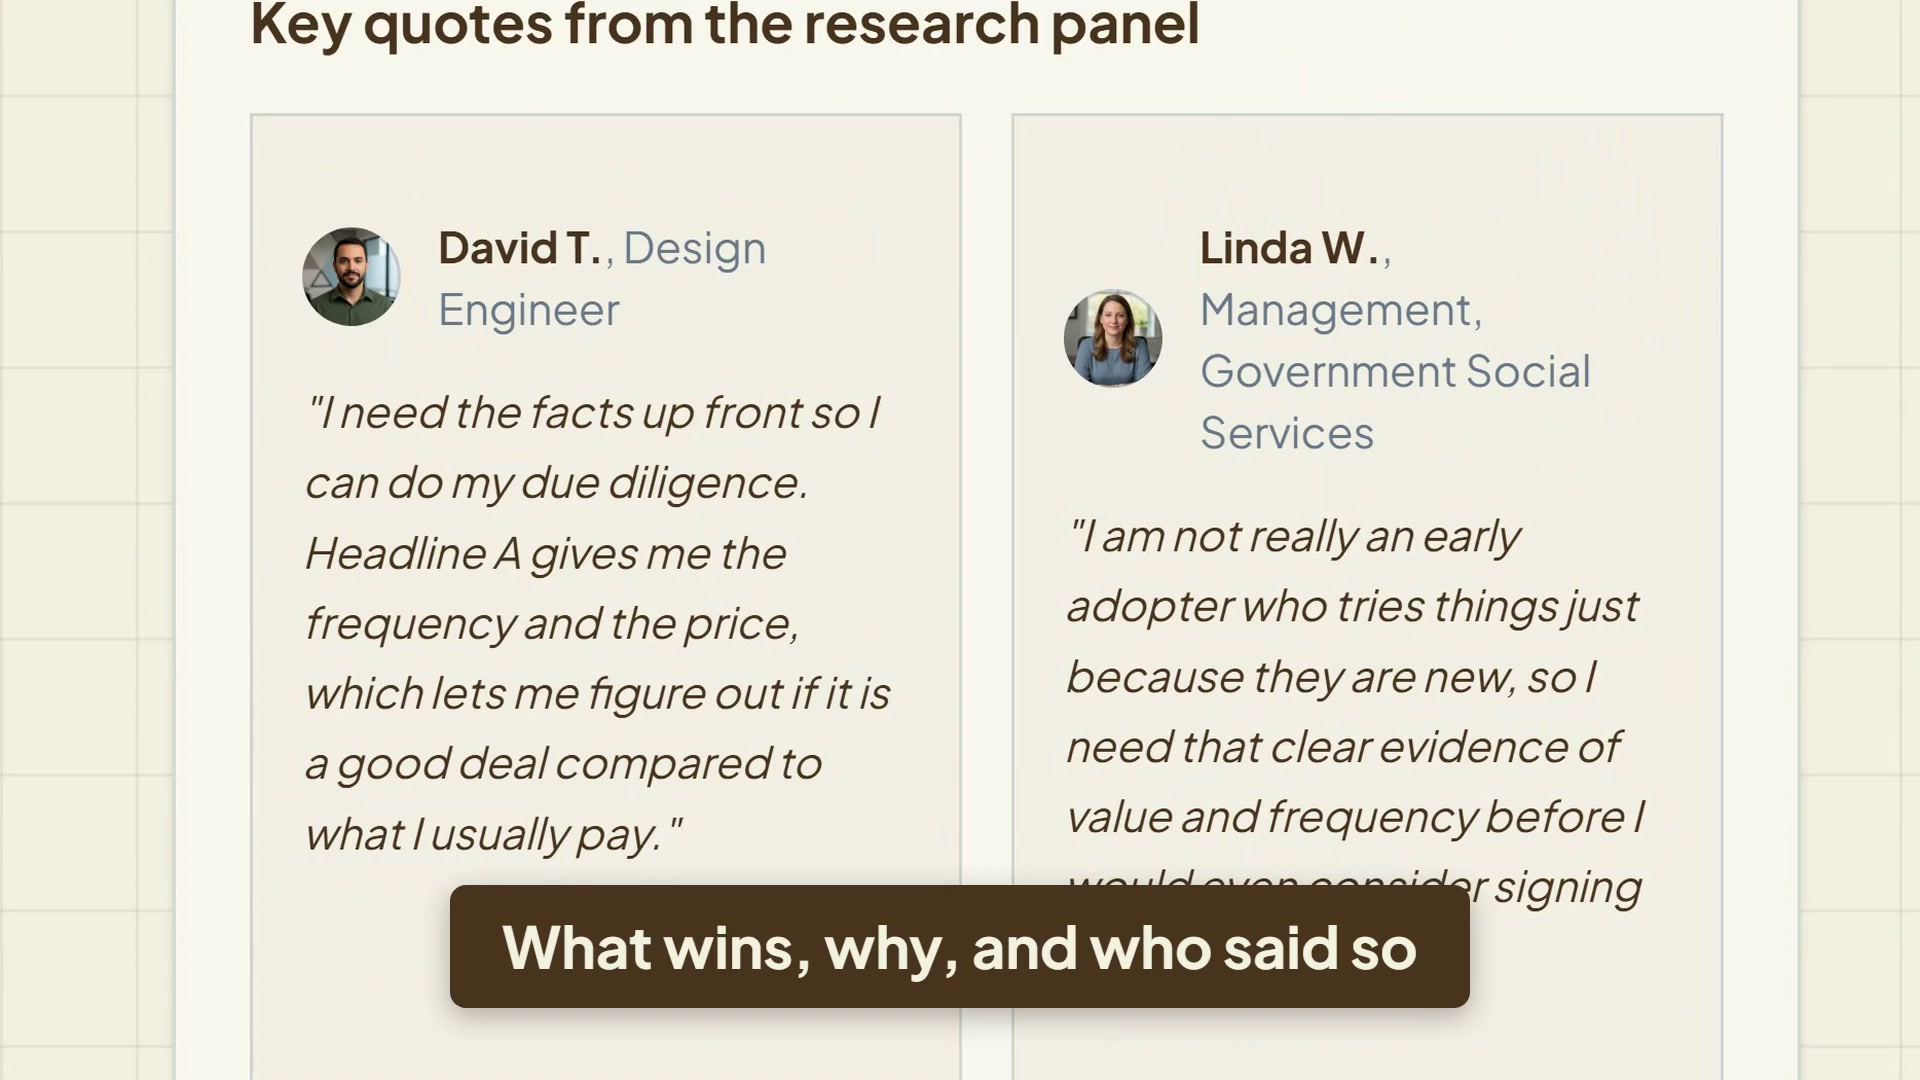
Checking with customers directly or customer simulations (as that is now a reasonable tool) allows managers and IC’s to gain insight into the Why in a cost-effective manner.
Even more important, having the ability to follow-up on an insight gained in that process can be crucial. A thoughtful follow-up can help you understand what they meant. The aim is to understand their perspective without making assumptions on their behalf. That means more of a conversation than a one off questionnaire or study.
So what can this look like in practice?
At Dilog, we’re exploring how conversational customer research can help teams investigate customer experiences and motivations in more depth.
We give teams a platform of digital twins sourced/validated/updated directly from interviews with your customers. A panel or user feedback specifically for you, transforming every decision with human-centred customer simulation and prediction on whatever question you ask.
Rather than relying exclusively on fixed survey responses, the aim is to make it easier to explore relevant follow-up questions and understand the context behind an answer.
Quantitative and qualitative data almost always work better together, the problem had usually been that getting qual reactions to your work was time consuming, costly, and a distraction from the multiple other things everyone is juggling. This isn’t an argument against dashboards, surveys or quantitative research, quite the opposite. Both together help address the issues outlined above.
Quantitative data helps us understand patterns, frequency and scale.
Qualitative research helps us explore experiences, motivations and context.
It’s our belief that behavioural data given at scale, at affordable rates, can inform better customer research by making the one off question into a conversation with your customer digital twins.
We give teams that are usually time poor and under a budget a flexible tool to check assumptions, improve overall outcomes, and deliver results faster.
Turning customer data into understanding
The challenge for any marketer, PM, design lead, or head of ecommerce starts at the analysis, with the goal to come up with something useful and actionable as a path to improve.
In those steps for analysis & hypothesis generation, the best practitioners are willing to question assumptions, investigate unexpected behaviour and listen to customers in their own words. To pull on the threads as they come out with a lack of ego.
At Dilog, we’re interested in making those conversations easier to have, and making the insights that come from them more useful.
Because knowing what happened is valuable, and understanding why is where things get interesting.
Got five minutes? We’d love your thoughts.
We’re an early stage startup exploring how to make customer research feel more like a conversation and less like another survey.
We’re inviting people working in UX, CX, Product and Customer Insights to try a short research experience and tell us what they think. To take part, you can sign up here.
If you’re eligible for our limited pilot, there’s a coffee e-gift card as a thank-you.
No need to say nice things. We want the useful feedback. Please join the Dilog platform with any initial problem you would like to test.
Try it with your own question
Start your free trial and put your first question to a real customer panel in minutes.
Start your free trial